Every Feature.
Every Detail.
GOPLC isn't a proof of concept. It's 280,000+ lines of production-grade Go code with capabilities that don't exist anywhere else in industrial automation.
GOPLC Dashboard
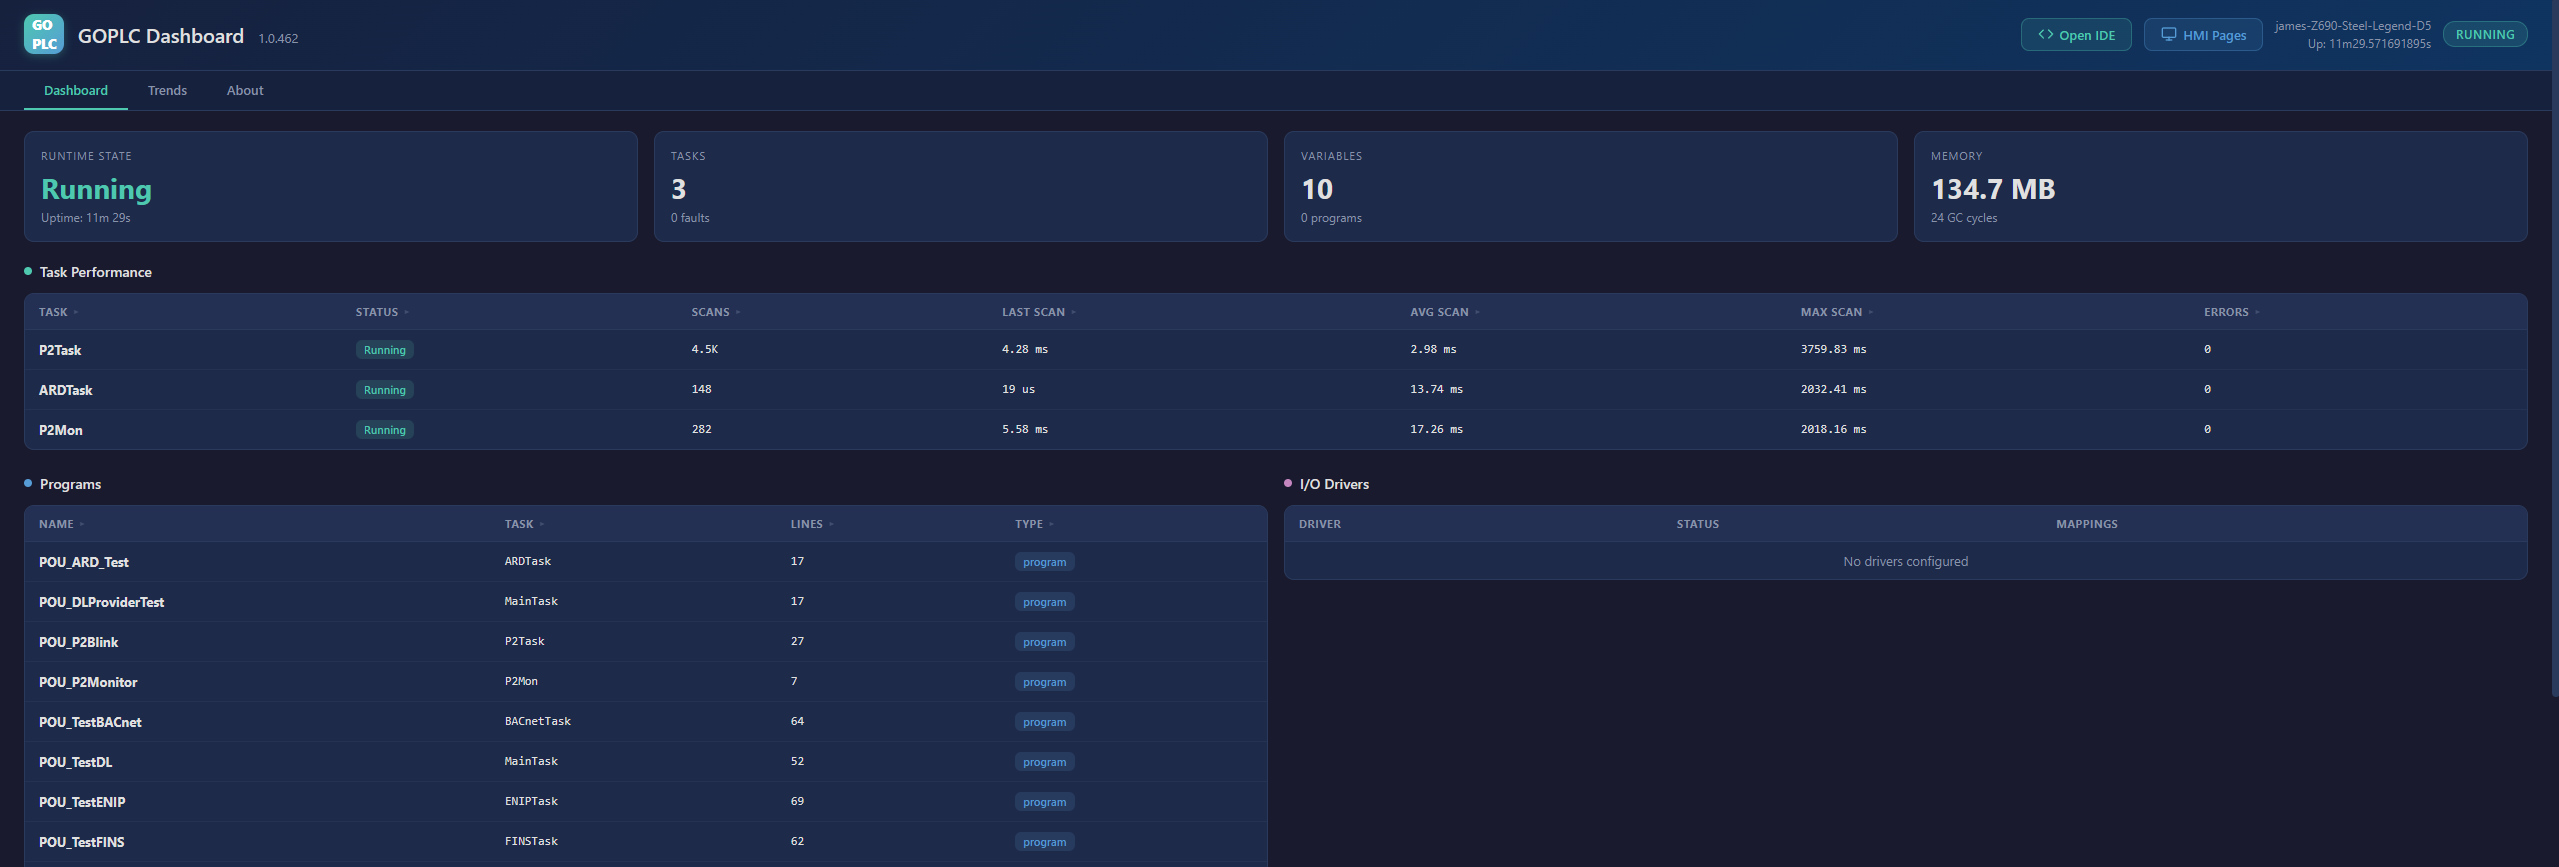
The dashboard gives you an instant overview of your entire runtime — state, uptime, task performance, program inventory, memory usage, and I/O driver status. All live, all in the browser.
Task performance metrics show scan counts, average and max scan times, and error counts for every running task. Click through to the IDE to drill into any program or variable.
- Runtime state, uptime, and memory at a glance
- Per-task scan performance with avg/max timing
- Program inventory with line counts and task assignments
Web-Based IDE with Online Mode
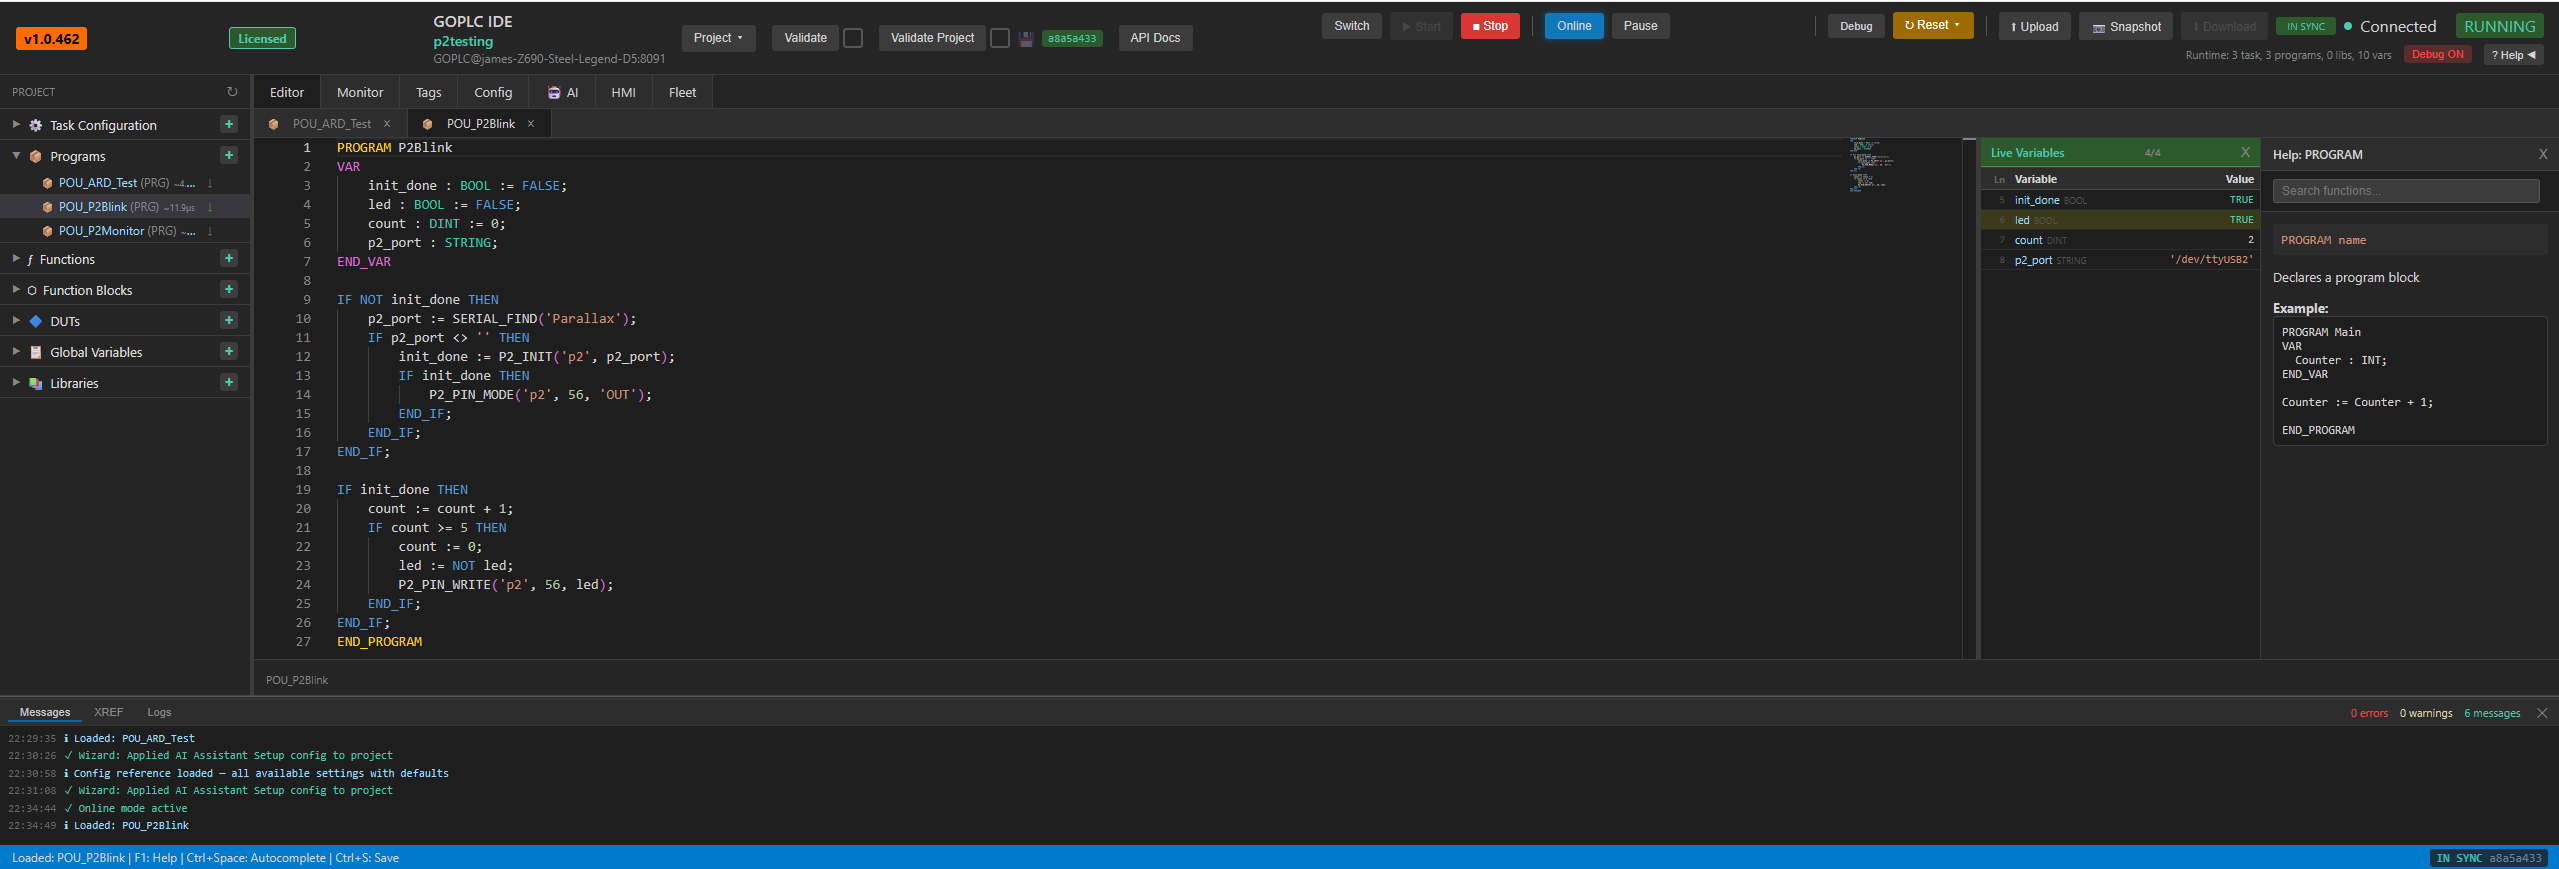
The same Monaco editor engine that powers VS Code, running in your browser. Full IEC 61131-3 Structured Text with syntax highlighting, autocomplete, code folding, and multi-cursor editing. The help panel shows function signatures and examples as you type.
Enter online mode and live variable values appear inline next to every declaration and assignment — color-coded by data type, updating in real time via WebSocket. Multiple users can monitor simultaneously from any browser.
- Autocomplete for 2,200+ built-in functions
- Real-time inline variable values via WebSocket
- Hot reload — deploy without stopping the runtime
- Multi-user simultaneous access from any device
Statement-Level Step Debugger
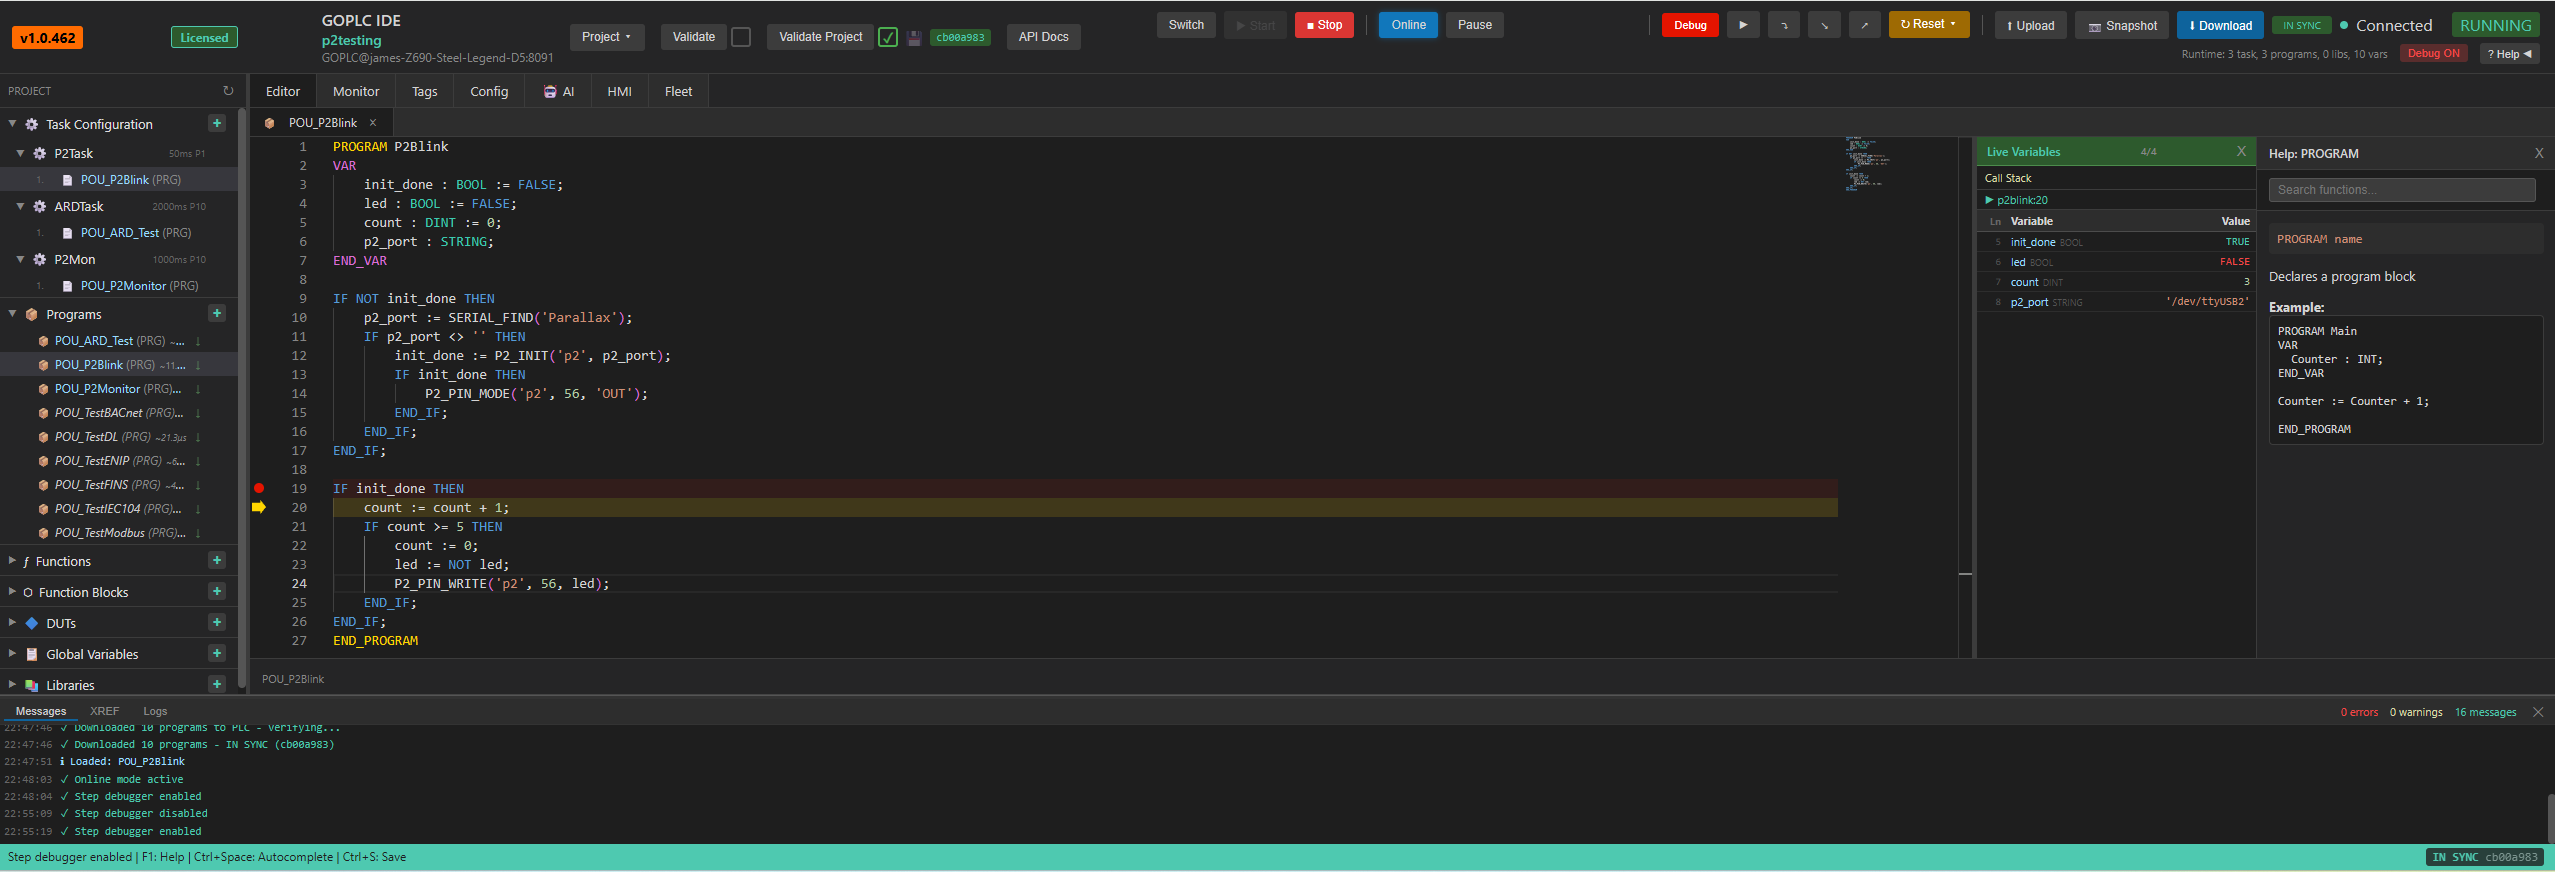
Traditional PLCs offer limited debugging — maybe online monitoring of variable values. GOPLC brings modern software debugging to industrial control. Set breakpoints on any line. Step through code statement by statement. The current execution line is highlighted, and you can inspect and modify variables in real time.
Ten dedicated API endpoints power the debugger, with multi-task awareness so you can debug across concurrent PLC tasks. All running in a standard web browser — no vendor software required.
- Breakpoints with yellow execution highlight
- Step into, step over, step out, continue
- Live variable inspection and modification
- Multi-task awareness across concurrent programs
AI-Powered Code Generation & Agentic Control
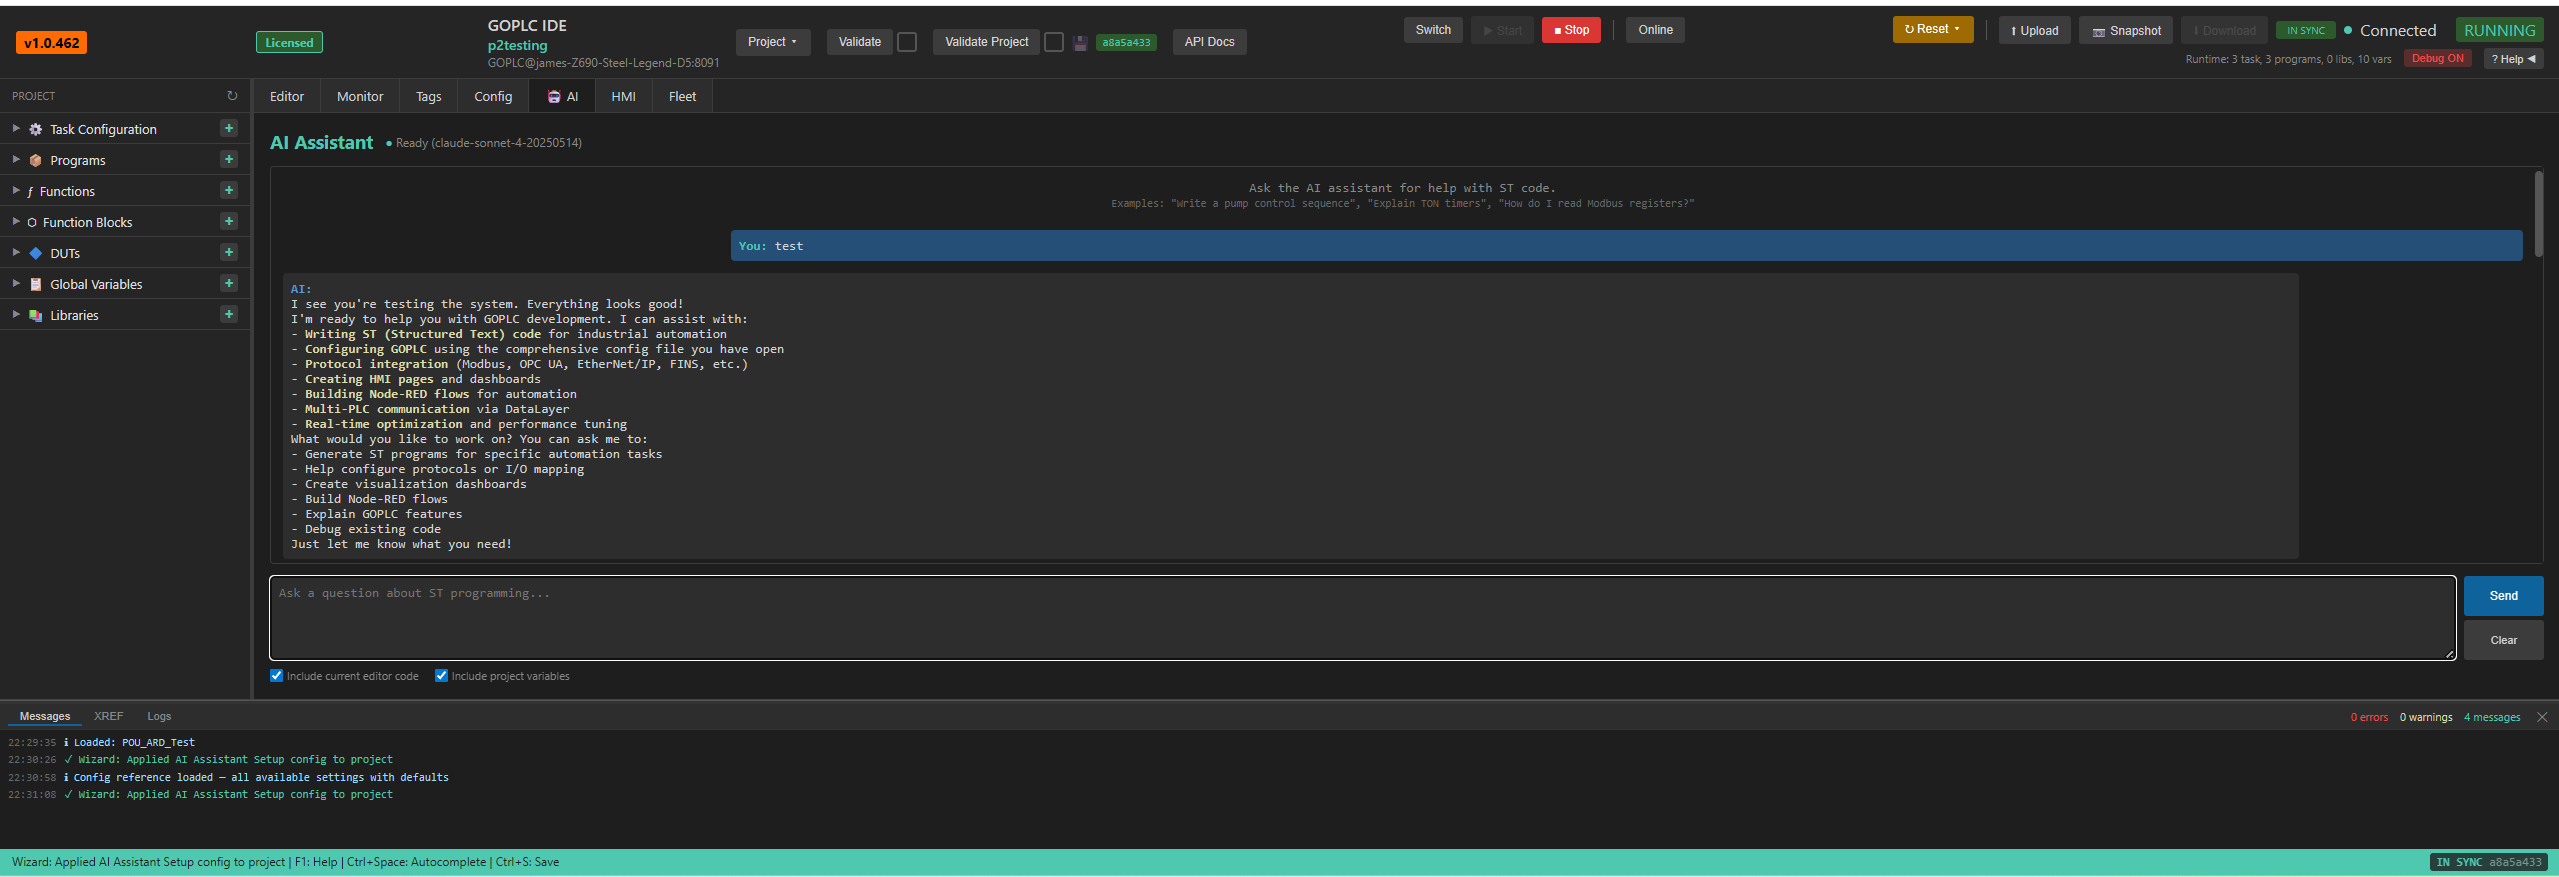
Describe what you want in plain English. GOPLC's AI generates working Structured Text code using the full registry of 2,200+ built-in functions — not generic code that references functions that don't exist, but code that actually compiles and runs.
The AI assistant can write ST programs, configure protocol drivers, create HMI pages, build Node-RED flows, debug existing code, and even explain GOPLC features. Beyond code generation, the agentic control loop lets AI operate the PLC directly through 12 built-in tools.
Supported AI Providers
Monitor & Variable Explorer
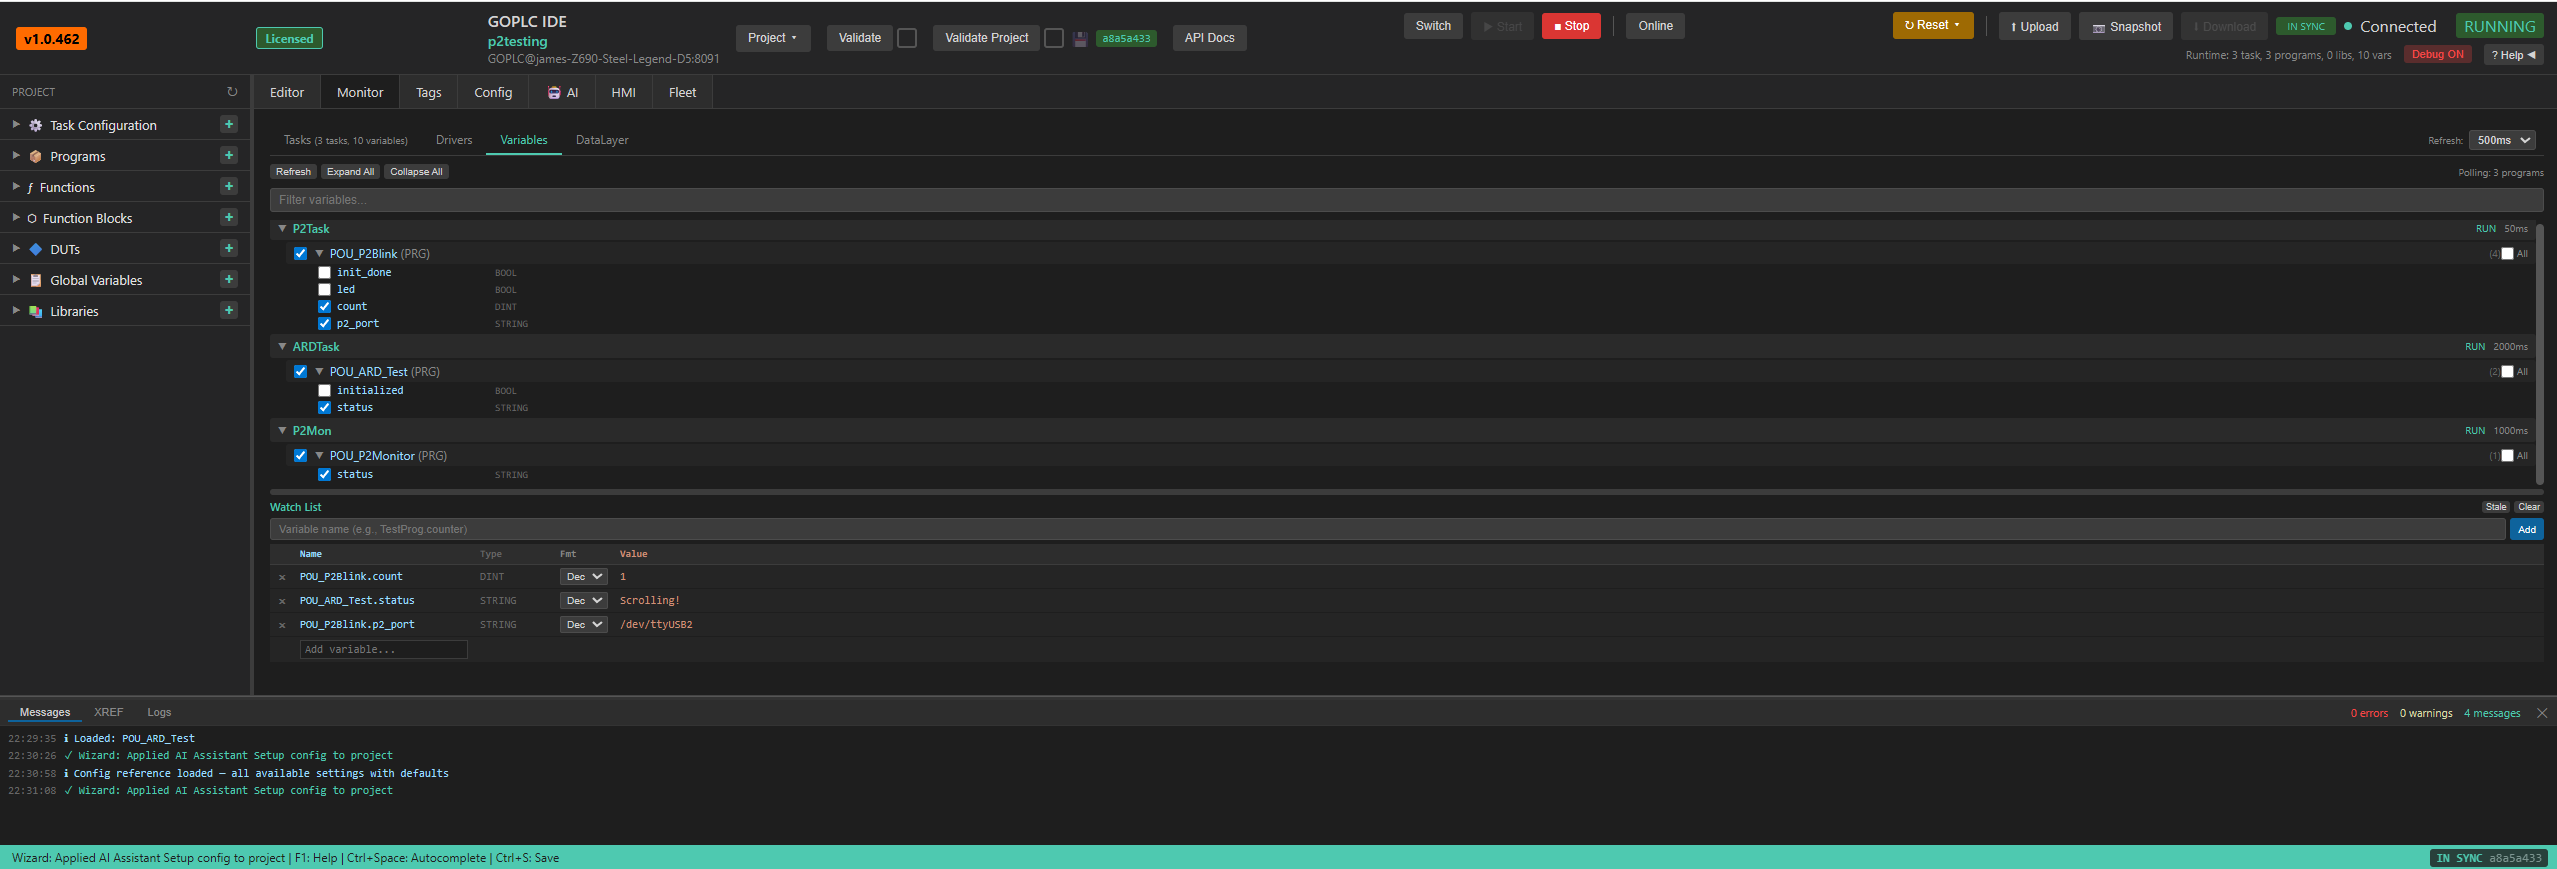
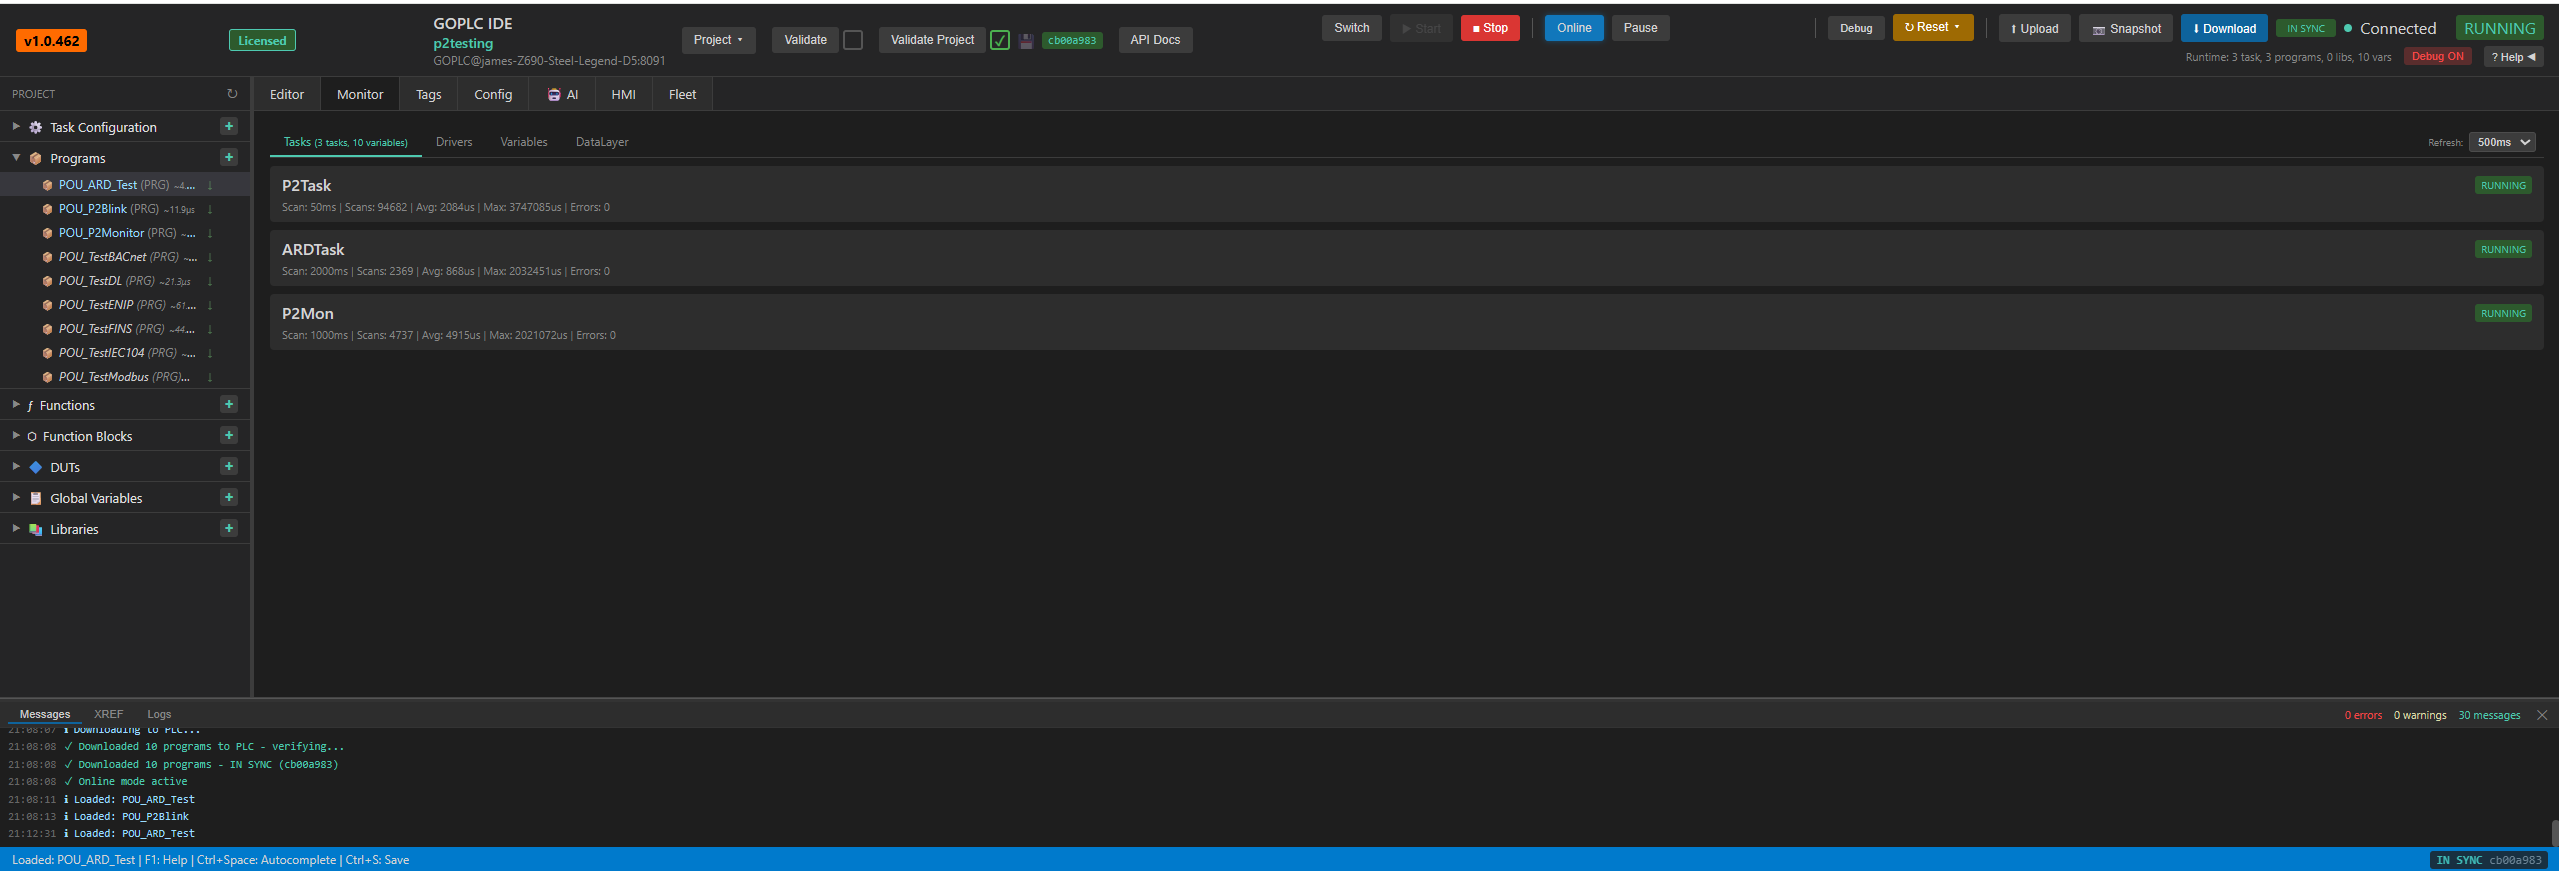
The Monitor tab gives you multiple views into the running system. The Tasks view shows every running task with scan counts, average and max scan times, and error counts. The Variables view expands each task into its program tree with every variable visible and watchable.
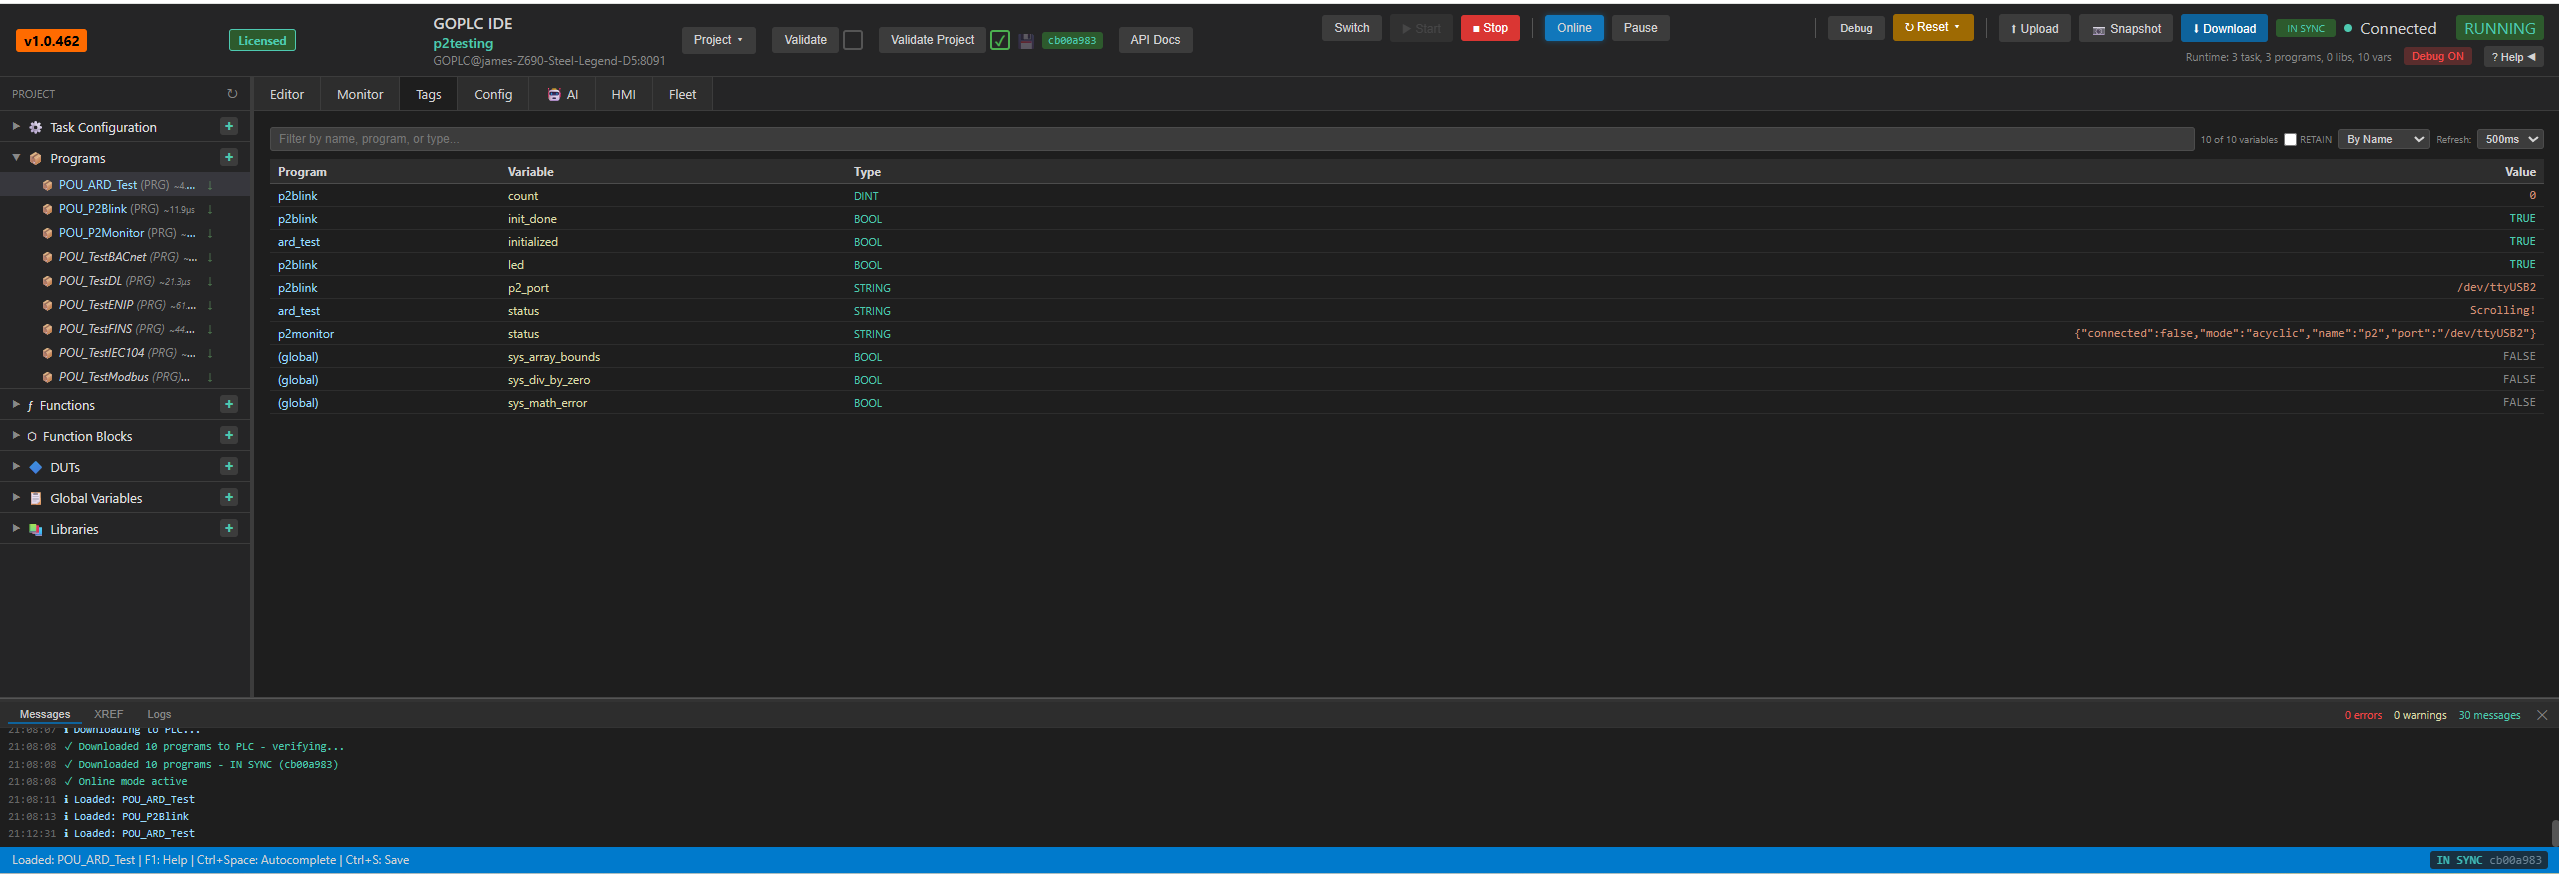
The Watch List lets you pin specific variables from any program for continuous monitoring. The Tags view provides a flat table of all variables across all programs with filtering, sorting, and live values.
- Task tree with expandable programs and variables
- Watch List for pinning variables across programs
- Tags view with flat table, filtering, and sorting
Boss/Minion Clustering
Traditional PLCs are islands. GOPLC breaks this paradigm with its Boss/Minion architecture — a central Boss coordinates thousands of Minion instances, each executing control logic independently at their own scan rates.
Tested at scale with 10,000+ concurrent PLC instances and 620,000+ aggregate scans per second. Linear scaling to 500 minions at 95%+ efficiency.
Benchmark Results (31 cores)
Fleet Management
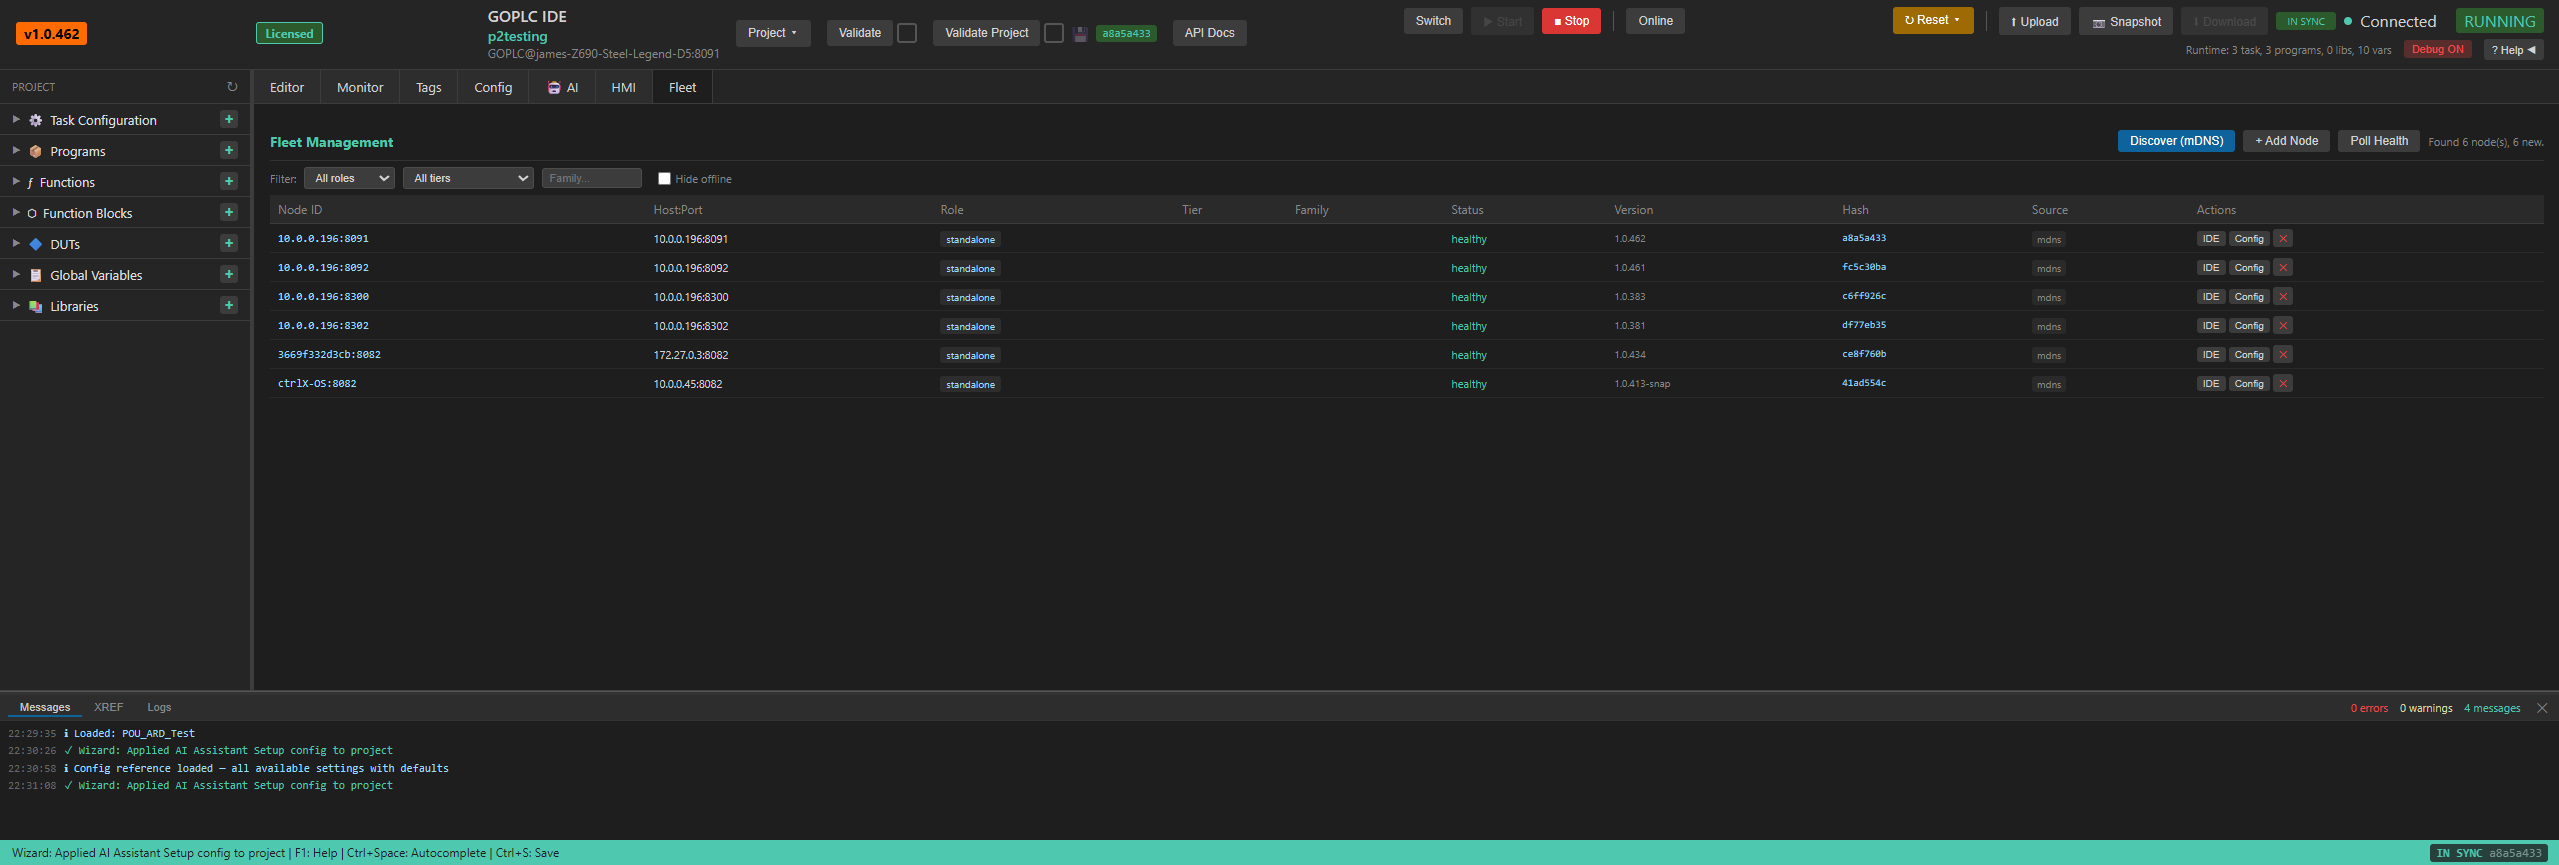
When you're running dozens or thousands of GOPLC instances across multiple sites, you need centralized visibility. Fleet Management uses mDNS auto-discovery to find every instance on the network, shows their version, health status, project hash, and role — all in a single table.
Push configurations to individual nodes or bulk-deploy across your entire fleet. Drift detection compares project hashes across all healthy nodes to catch configuration divergence. Any GOPLC instance can become a fleet manager — just enable it in config.
- mDNS auto-discovery & persistent node registry
- Bulk push & atomic deploy across the fleet
- Drift detection across all healthy nodes
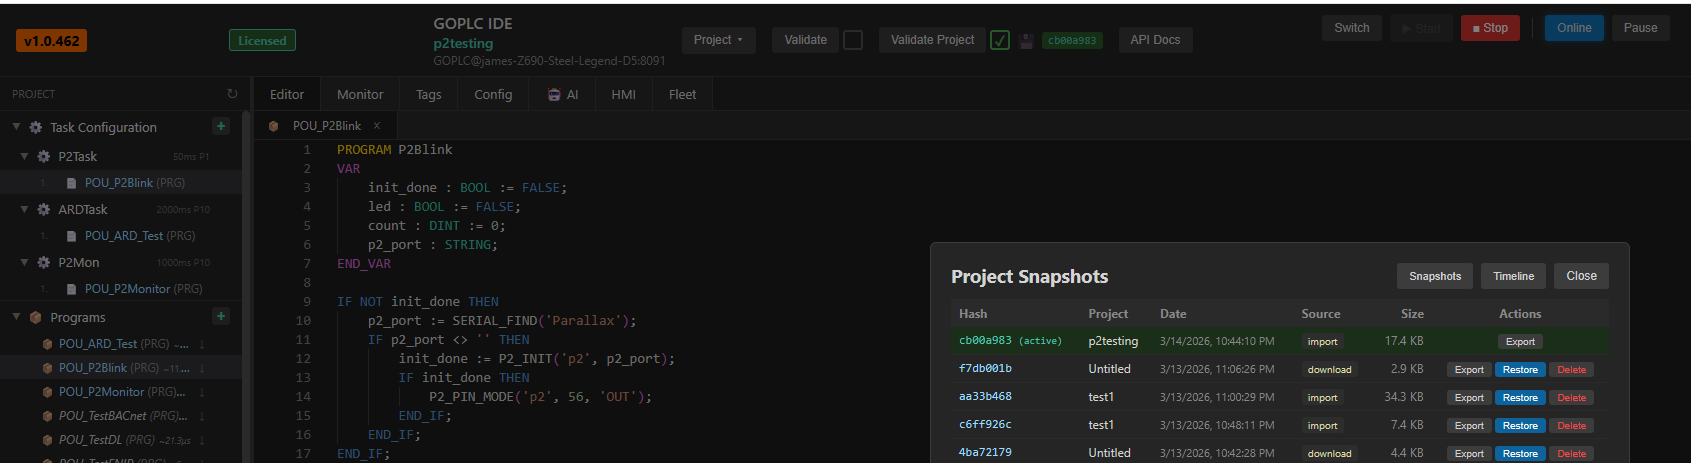
Project Snapshots
Every project download and import is automatically captured as a snapshot — stored with SQLite metadata and gzip compression. Browse your project history, restore any previous version, or export snapshots as .goplc files.
The fleet manager automatically collects snapshots from remote nodes when their project hash changes, giving you a centralized backup of every configuration change across your entire deployment.
- Auto-save on every download and import
- Restore, export, and timeline views
- Auto-prune at 50 local, unlimited fleet snapshots
Node-RED with Custom PLC Nodes
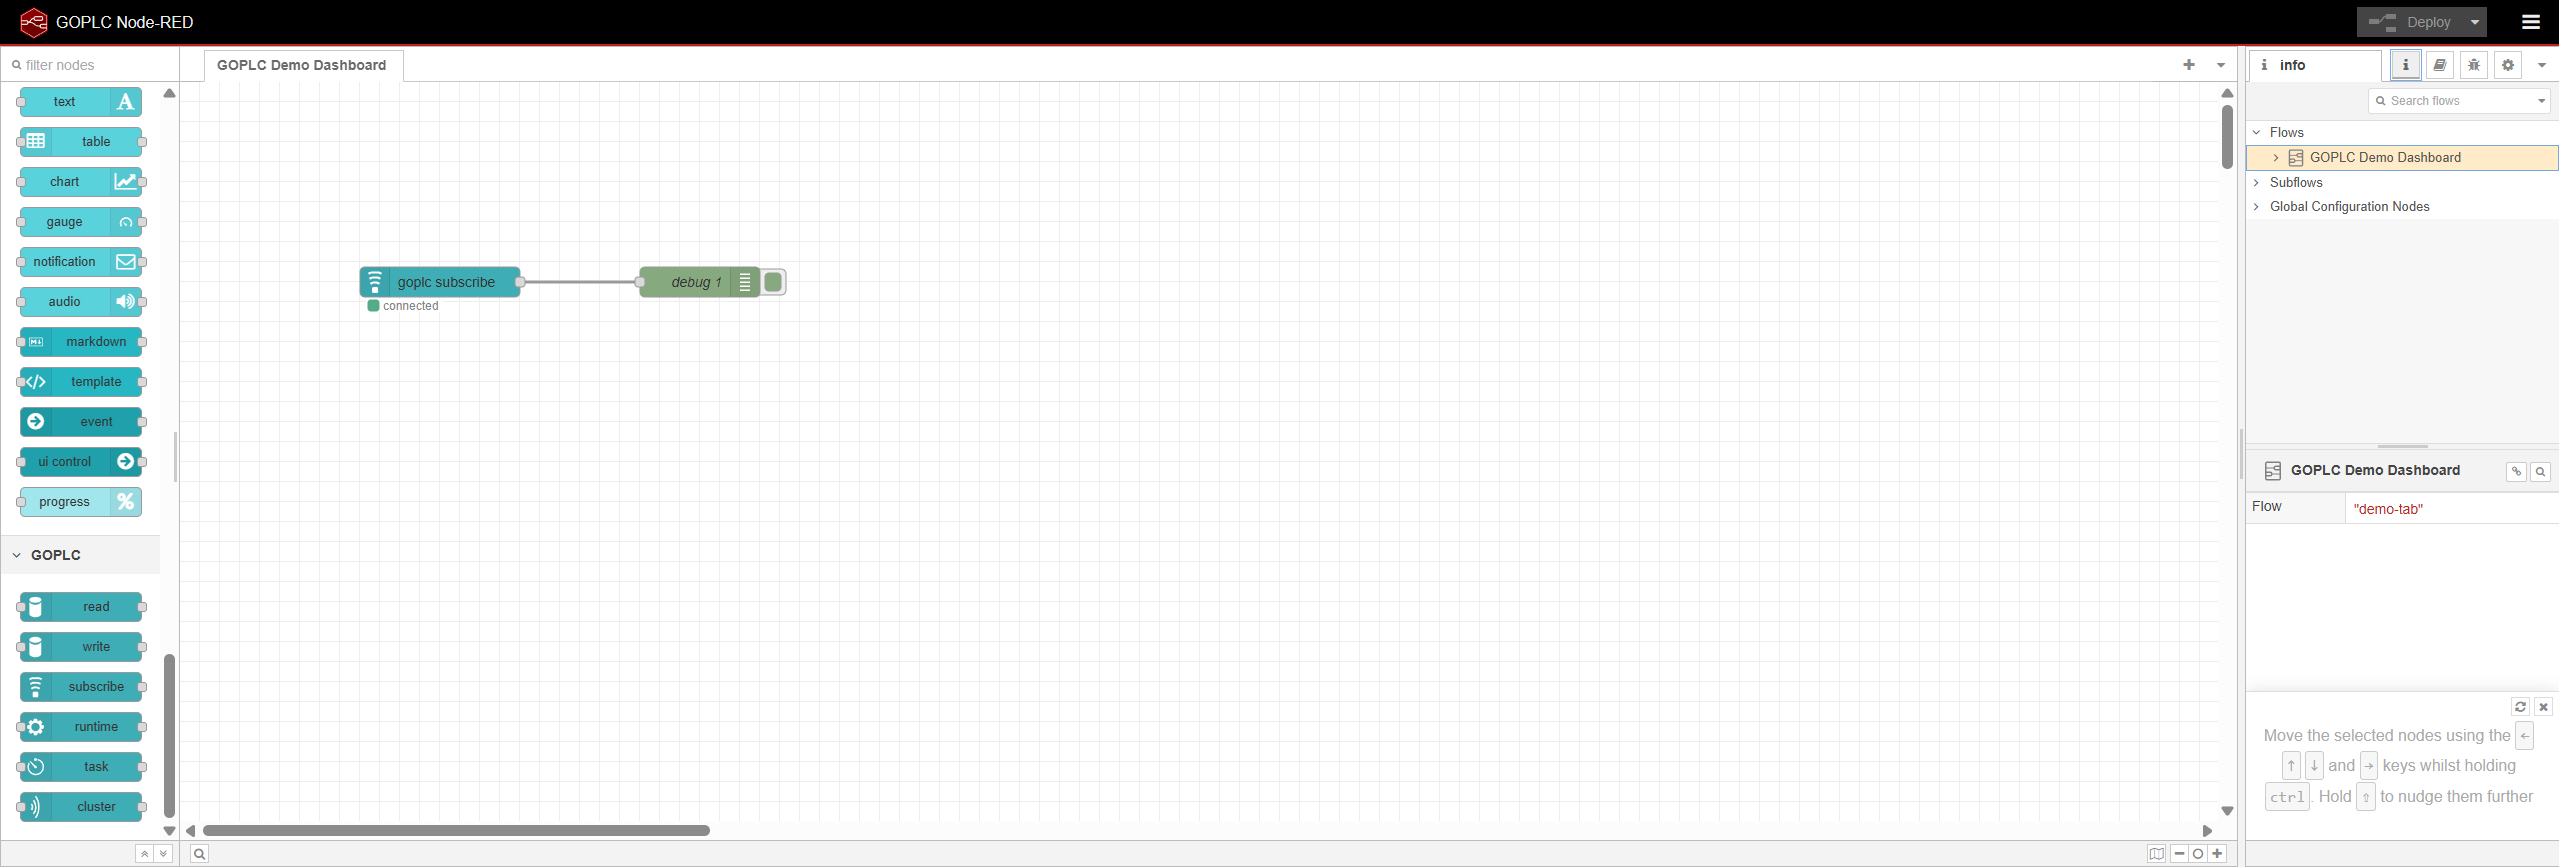
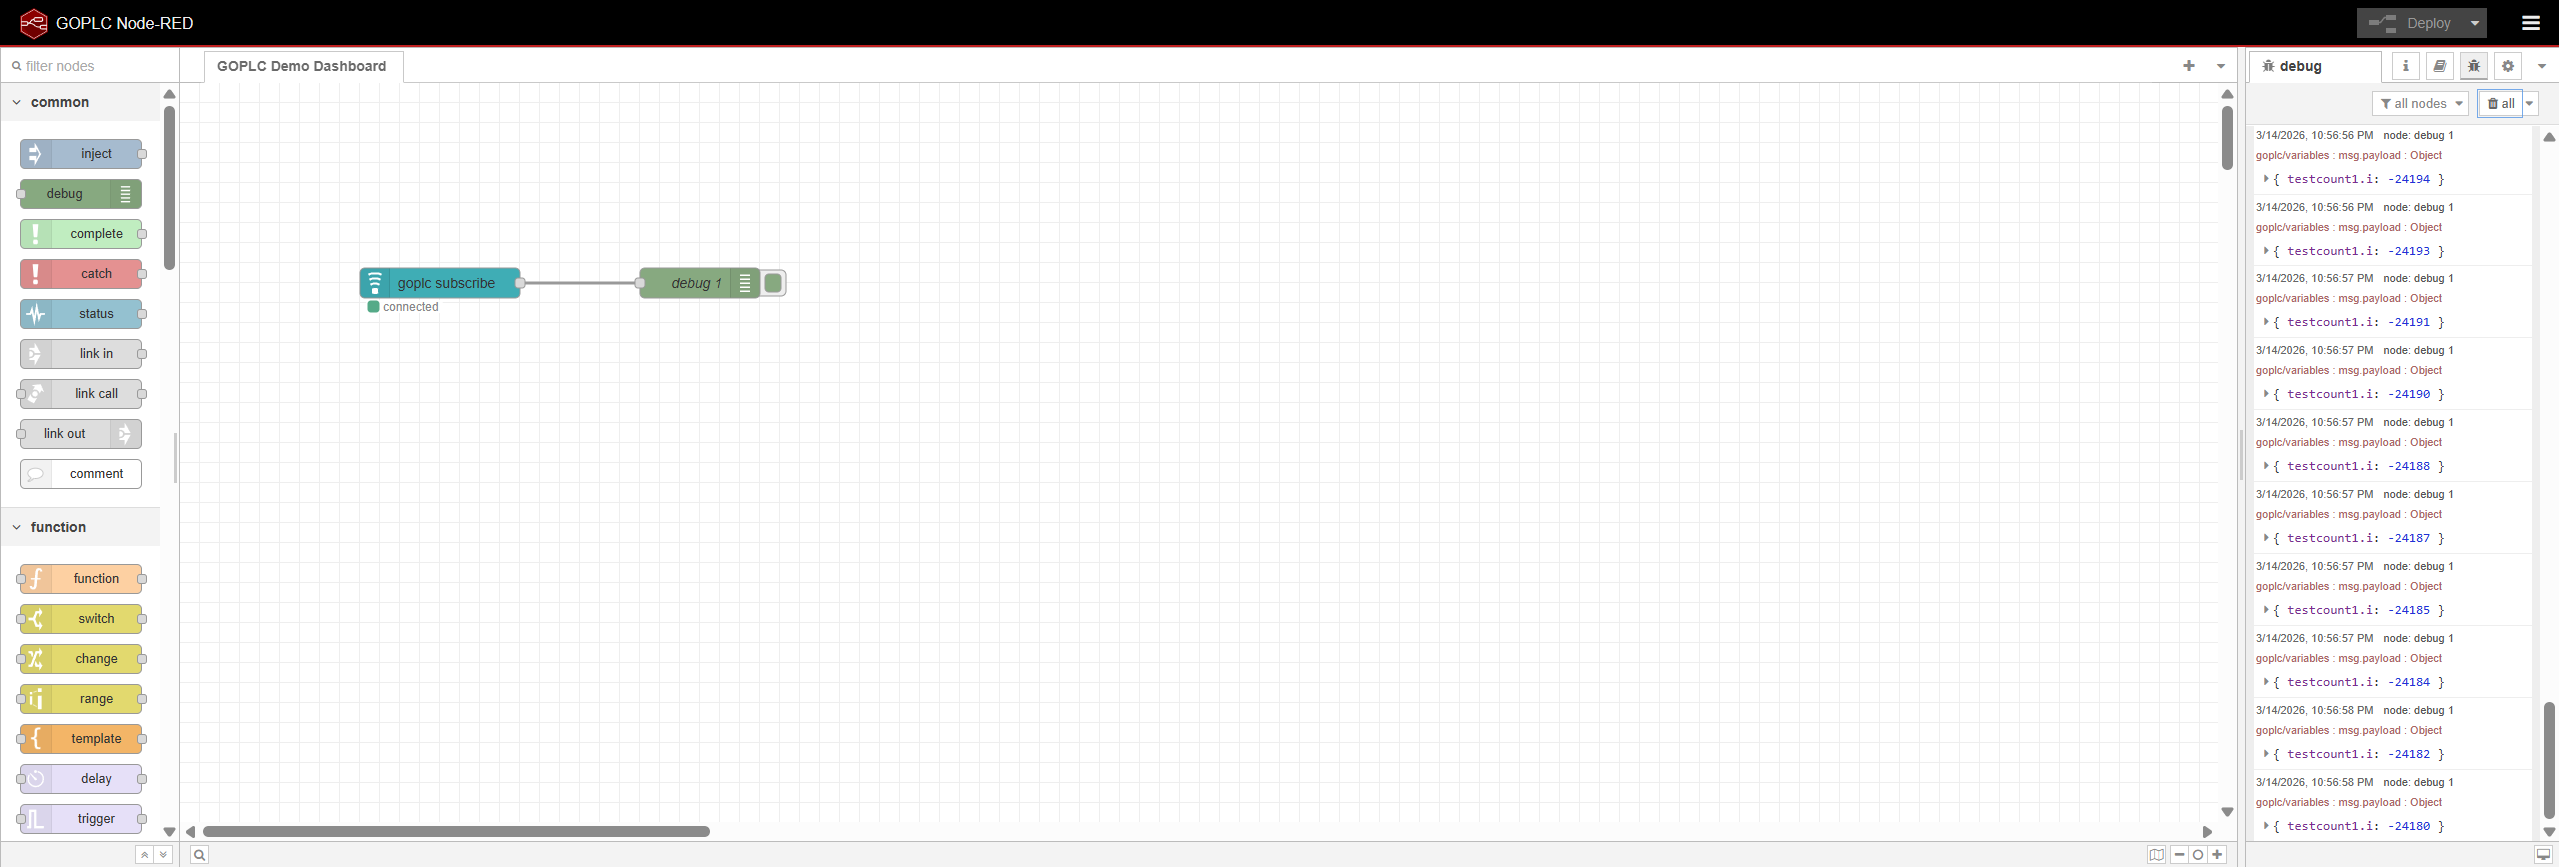
GOPLC manages Node-RED as an integrated subprocess — auto-install, lifecycle management, and reverse proxy. The custom GOPLC node palette includes read, write, subscribe, runtime, task, and cluster nodes for direct PLC integration.
Build operator dashboards with Dashboard 2.0, connect to MQTT brokers, push data to databases, or create cloud integrations — all visually. AI can even generate complete flows from natural language descriptions.
- Custom GOPLC node palette (read, write, subscribe, runtime, task, cluster)
- Dashboard 2.0 for professional operator interfaces
- Auto-install and managed lifecycle
Config Wizard & Runtime Configuration
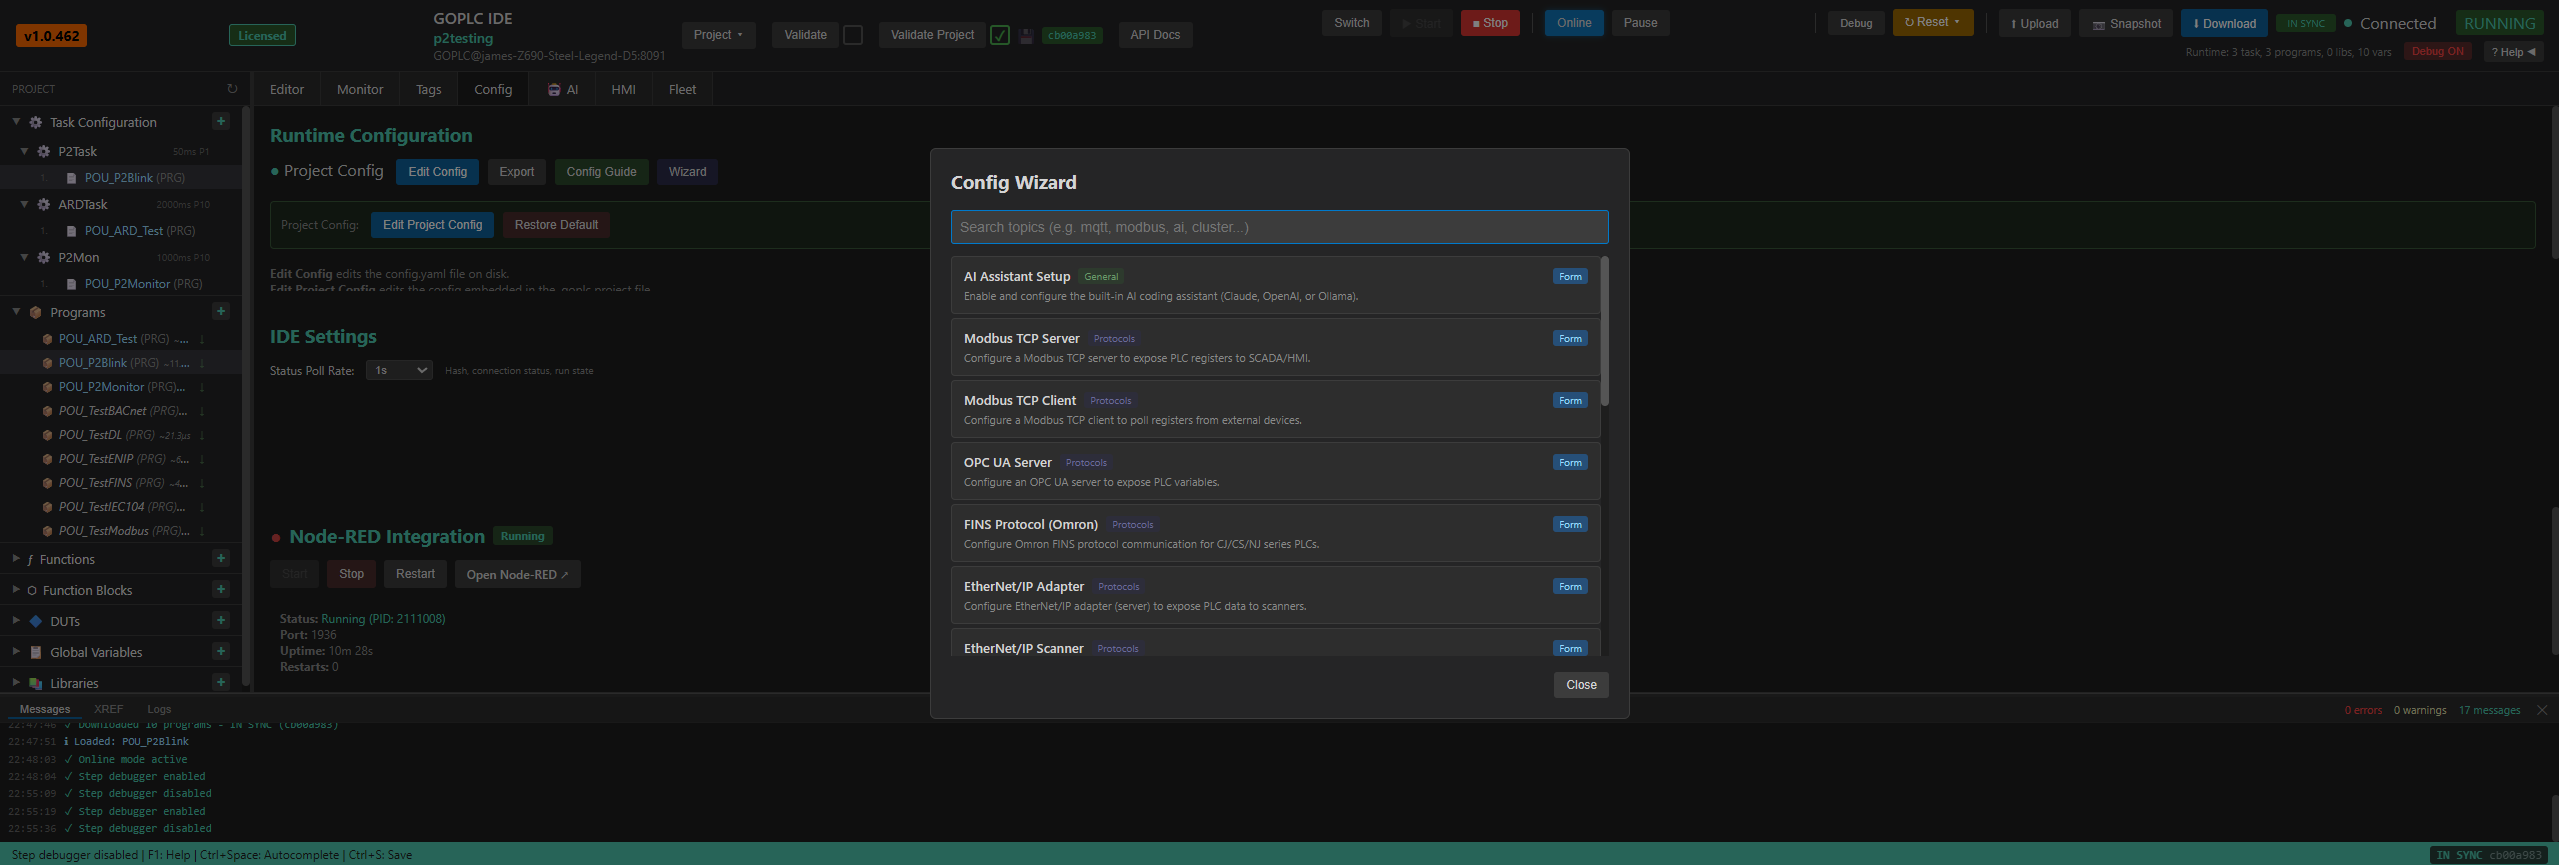
The Config Wizard provides guided setup for every major feature — AI Assistant, Modbus TCP Server and Client, OPC UA Server, FINS Protocol, EtherNet/IP, and more. Each topic has sensible defaults and one-click Apply.
The runtime configuration page manages the project config YAML, Node-RED integration (with status, uptime, and restart controls), and IDE settings like status poll rate. Export your config or restore defaults at any time.
25+ Native Protocol Drivers
60,000+ lines of protocol code. Every major industrial protocol, built in. No add-on modules, no extra licenses.
And That's Not All
Every capability you'd expect from an enterprise PLC platform — and several you wouldn't
Multi-Task Scheduler
Run multiple concurrent tasks at different priorities and scan rates. Watchdog timers, hot reload, and per-task reload without stopping the runtime.
Real-Time Performance
Memory locking, CPU affinity, SCHED_FIFO, and GC tuning. 20-50µs scan execution. 5.5x p95 jitter reduction in real-time mode.
Propeller 2 Hardware I/O
56 hardware functions — GPIO, Smart Pins, UART, I2C, SPI, ADC/DAC, PWM, encoders, and OLED display. Auto-discovery, native Go loader, 3Mbaud binary frame protocol.
Arduino Support
19 Arduino functions — GPIO, analog, I2C, servo, sensors (temperature, ultrasonic), WiFi, BLE, and LED matrix. Same serial frame protocol as P2.
MCP Server
Schema-first MCP server exposing runtime control, variable access, program management, fleet operations, debugging, and the foundation registry — accessible from Claude Code, Cursor, or any MCP client. Tool count grows with the runtime; query the live registry to enumerate.
Gateway Deployer
CSV I/O maps to complete Modbus gateway projects in one command. Auto-generates GVL, Poll, Alarm, and Server programs. Tested with 10,000 tags.
250+ REST API Endpoints
Complete programmatic access to every runtime capability. Programs, tasks, variables, fleet, snapshots, system control — all documented and accessible.
L5X Import — Rung-by-Rung
Studio 5000 / RSLogix exports translate to GOPLC ST rung-by-rung. Bit / timer / counter / compare / math / move / file ops — the supported instruction set is the headline. Anything unrecognized surfaces as a visible inline warning, never a silent gap.
Protocol Analyzer
Built-in protocol analyzer with PCAP export. Capture, inspect, and debug industrial protocol traffic without external tools.
Enhanced PID + Autotune
Rockwell-style PIDE function block with independent / dependent / parallel gain forms, output rate limiting, bumpless manual↔auto, and relay-feedback autotuning (Åström-Hägglund). Verified Ku/Pu recovery on FOPDT plant simulations.
Video Historian + Vision
Burst capture from cameras (pre/post buffering, SQLite-indexed) plus a pluggable CV pipeline: ONNX inference, gauge reader, ZXing barcode/QR — all pure-Go, no Python sidecar. Detections fire events; bursts hyperlink from event entries.
Foundation Registry
Every foundational package ships a .foundation.yaml describing what it owns and how it connects. Queryable via CLI, REST, and MCP — so AI agents answer "where does X live" and "what breaks if I touch Y" in tokens, not grep tours.
Built-in Trend Component
Reusable <goplc-trend> web component with auto-scale per pen, BOOL pulse ticks, drag-to-resize, click-to-pin cursor, CSV export, and an event-marker overlay band that surfaces alarms and operator actions inline with the data.
Embedded Brokers
MQTT (mochi-mqtt) and NATS (nats-server + JetStream + KV) brokers ship inside the runtime binary. No external broker process to deploy, monitor, or fail independently. Pure-Go ZMQ PUB/SUB on the same channel for high-throughput pub/sub.
Ready to Get Started?
See pricing options or get in touch to discuss how GOPLC fits your application.